WinPicks Reference Manual
Section 7.6. Power Ratings
WinPicks excels at generating power ratings. In fact, we use WinPicks to generate the MicroBrothers power ratings, which have been distributed through a number of electronic and print publications. To generate power ratings, select POWER RATINGS from the VIEW menu. You then have three options to choose from, as described in the following sections.
Current Formula
This option ranks all teams using the prediction formula and database that is currently in use. If you change formulas or use a different database, the power ratings will change.
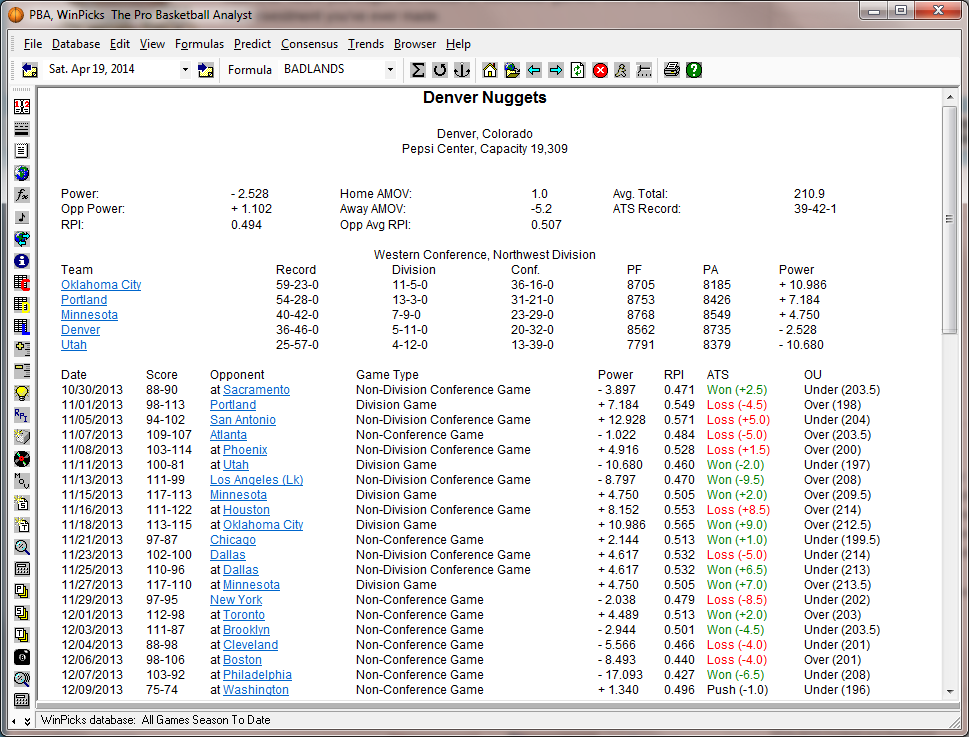
When you select this option, you'll see a list of every team ranked according to their power rating. The average team has a power rating of 0. Above average teams have positive power ratings, below average teams have negative power ratings.
By subtracting one team's power rating from another, you can obtain the predicted point differential between the two teams. For example, if Team A has a power rating of 10, and Team B has a power rating of 6, your formula would predict Team A to defeat Team B by 4 points. The power ratings for both NFL and college football assume that the game is being played at a neutral site, and a home field advantage needs to be added or subtracted to obtain the final prediction. NBA teams receive two power ratings, one for their home performance, and one for their road performance. To project the point spread for a game, use the "Home Power" number for the home team, and the "Away Power" number for the road team.
Rating Percentage Index (RPI)
The Rating Percentage Index (RPI) is widely used to produce power ratings. It is best known for its use in college sports, where it plays a key role in the team selection for the NCAA basketball tournament, and for the NCAA football Bowl Alliance.
The RPI does not produce a point differential, but is still a useful handicapping tool. It essentially measures a team's strength of schedule and how a team does against that schedule. Unlike most power rating systems, the RPI does not consider margin of victory or how well a team has played. It only considers whether a team won or lost. In fact, the RPI is based entirely on winning percentage. It is based 25% on a team's winning percentage, 50% on the winning percentage of their opponents, and 25% on the winning percentage of their opponent's opponents.*
For example:
- Team A is 4-1 (win percentage = .800)
- Team A's opponents are 12-8 (win percentage = .600)
- Team A's opponent's opponents are 64-16 (win percentage = .800)
- RPI = (0.25 * .800) + (0.5 * .600) + (0.25 * .800)
- RPI = .200 + .300 + .200 = .700
The strength of schedule rating that WinPicks displays is based on the last two components of the RPI formula:
SOS = (2/3) * Opponent's Winning Percentage + (1/3) * Opponent's Opponents Winning Percentage
* When used for college sports, the RPI only counts games involving Division-1 opponents.
WinPicks weights away and home records differently when calculating winning percentages for the RPI. A road win is weighted as 1.4 when calculating the winning percentages, and a road loss is weighted as 0.6. Likewise, a home win is weighted as 0.6, and a home loss is weighted as 1.4. These adjustments apply to all percentages; e.g. a team's winning percentage, and their opponent's winning percentages.
The home/away rating weighting factors were added to WinPicks based on changes made to the RPI in December 2004 for college basketball. Previously all games were given the same weight, but historically, since home teams have won approximately two thirds of all games in college basketball, the RPI calculations were modified by the NCAAB committee. The WinPicks RPI rating has been adjusted to remain consistent with this change.
Several published versions of the RPI use slightly different ways to calculate the opponent's winning percentage. Therefore, the WinPicks RPI may not exactly agree with what you see in other places, but it should be very close. The exact RPI calculations in use by the NCAAB are difficult to verify. All published sources of the RPI rating we have found do not disclose the opponent winning percentages and the opponent's opponent winning percentages which were used to calculate the RPI rating, unlike WinPicks.
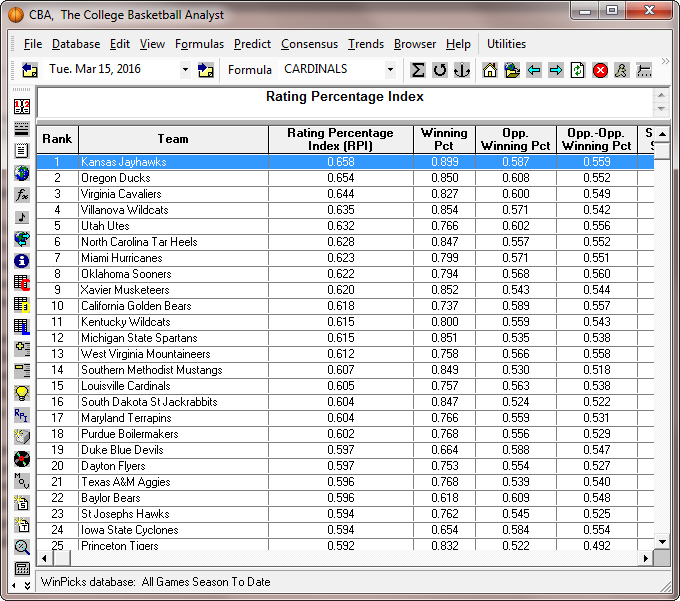
Figure 7.60 - Ratings Percentage Index (RPI) for CBA
Charts
This feature produces a grid containing each team's power rating during each week of the season. By looking at these numbers, you can tell if a team has been improving or getting worse as the season goes on.
Since it can be difficult to analyze a row of numbers, WinPicks can display a graph of the weekly power ratings. To display this graph, select CHARTS and then select a team from the alphabetical list.
A sample power ratings graph is shown in Figure 7.61. The graph is a standard Cartesian graph, with one data point for each game. The games are plotted on the x-axis, and the power ratings are plotted on the y-axis. A solid line connects the data points. A dashed line shows the slope of the data after linear regression is performed. By looking at the slope of the dashed line (whether it goes up or down) you can tell if a team is getting better or worse as the season goes on.
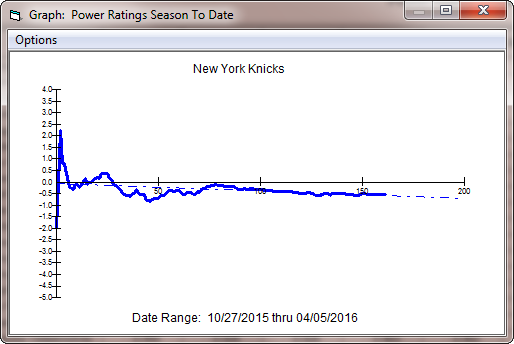
Figure 7.61 - A Sample Power Ratings Graph (PBA)
The power ratings graph has its own window with its own menu (called the OPTION menu). When you select this menu, you can print the graph, copy it to the clipboard, or exit.