WinPicks Reference Manual
Section 8.4. Analyzing a Prediction Formula
You can analyze the straight-up record (SUR) against the spread record (ATS), and totals record (over/under) of any prediction formula. This feature allows you to monitor the performance of your prediction formulas, and to test new formulas before you use them.
To analyze a formula, select ANALYZE THE CURRENT FORMULA from the FORMULAS menu. Then, select SEASON TO DATE ONLY to analyze all games from the current season. Select TEST USING LAST N DATES to analyze a formula over any number of past dates in the database. Select PAST SEASONS to pick a range of one or more past seasons to analyze. You can analyze the entire database by selecting a range that extends from the oldest to the current season.
Once you begin an analysis, you may stop it at any time by selecting
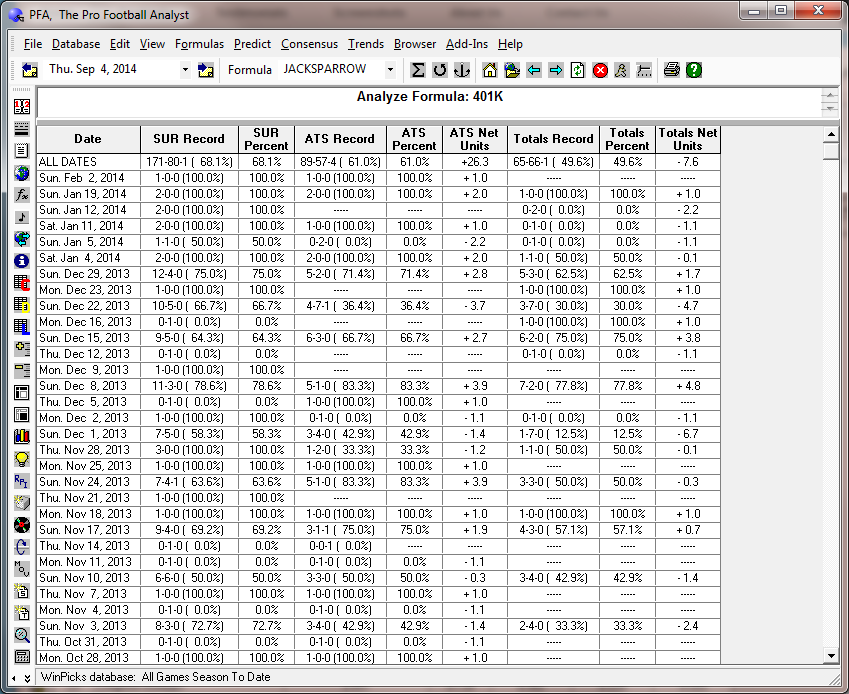
Figure 8.40 - The Analyze Formula Screen (PFA)
The ANALYZE FORMULA screen has eight columns:
- Date - This shows the schedule date for which the formula is being analyzed.
- SUR Record - This shows the formula's straight-up record for every game played.
- SUR Percent - This shows the formula's straight-up winning percentage for every game played.
- ATS Record - This shows the formula's record for the games that it recommended against the point spread.
- ATS Percent - This shows the formula's winning percentage for the games that it recommended against the point spread.
- ATS Net Units - This shows the number of net units that the formula has won or lost for the games it recommended against the point spread. Net units are calculated as plus 1 unit for every pick won, and minus 1.1 units for every pick lost. Formulas that would have won money when used for legal sports betting will show a positive value for net units, assuming that the same amount was wagered on every pick.
- Totals Record - This shows the formula's record for the games that it recommended against the totals line.
- Totals Percent - This shows the formula's winning percentage for the games that it recommended against the totals line.
- Totals Net Units - This shows the number of net units that the formula has won or lost for the games it recommended against the totals line. Net units are calculated as plus 1 unit for every pick won, and minus 1.1 units for every pick lost. Formulas that would have won money when used for legal sports betting will show a positive value for net units, assuming that the same amount was wagered on every pick.
The top line in the grid shows the formula's cumulative record for all of the dates being analyzed. When you evaluate formulas, keep in mind that an SUR of 65% or better is very good, and that 70% is excellent. An ATS or totals record of 52.4% is required to break even if you are using the formula for legal sports betting. An ATS or totals record of 55% or better is very good, and anything over 60% is excellent.
It is important to note that formulas with a good ATS record may not do well on totals, and vice versa. If you use the SureLock Formula Wizard you can choose whether the formula that you create is optimized to beat the spread or to beat the totals line.
ANALYZE is a very powerful tool. It allows you to measure the quality of a prediction formula by looking at its past results.
Analyze All Formulas
Selecting this option will analyze all of your formulas at once. If you have a lot of formulas, this can take a few minutes or longer. After the formulas are analyzed, you are returned to the MY FORMULAS screen where the results are summarized.
Formula Analysis SUR Filter
Selecting this option from the FORMULAS menu will allow you to limit the games included in the straight-up record (SUR) analysis of a prediction formula. The points spread range is selectable from 1 to 25 points, or you can select all games (the default setting). This feature provides a more realistic look at a formula's ability to pick up straight winners, because you can filter out those "obvious" winners where the spread is more than 25 points. You can also limit the SUR analysis to games that are most likely to have a money line - for example, where the spread is 15 points or less, to find the formulas that work best for money line wagers. The Formula Tuner will tune SUR formulas based on this setting, so you can tune a formula to pick SUR winners in games with small point spreads.
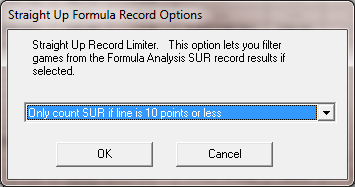
Figure 8.41 - The Formula Analysis SUR Filter Window